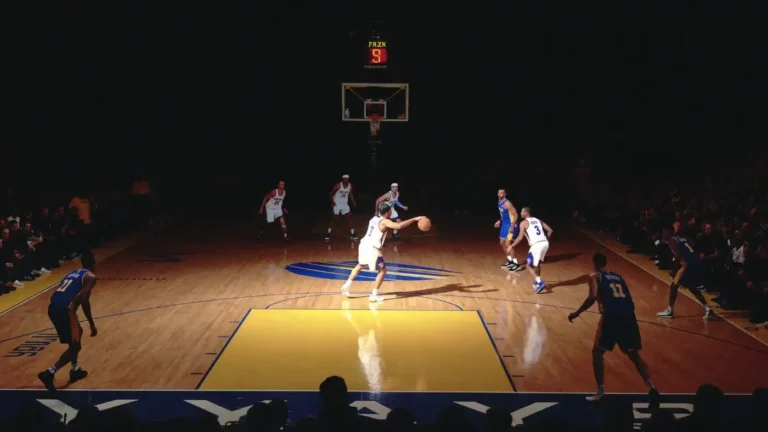
Every NBA broadcast now speaks a second language — true shooting, pace, net rating, shot quality. This hub translates all of it: what each number means, why it replaced the older stat, and how to read a game through it.
The first rule: think per possession, not per game
Raw totals lie. A team that plays fast piles up points and rebounds simply because it gets more turns with the ball. Modern analysis divides everything by possessions — typically expressed per 100 — so a slow, surgical offense and a sprinting one can be compared honestly. Almost every stat below is built on that foundation.

The efficiency family
Field-goal percentage treats a corner three and a contested long two as equals — which is why nobody serious uses it alone anymore. Effective FG% gives threes the extra 50% they are worth, and true shooting (TS%) folds free throws in as well, producing the cleanest single answer to “how efficiently does this player score?” League-average TS% has hovered around the high .50s in recent seasons; sustained marks above .600 are elite territory.
The Four Factors
Dean Oliver’s framework still explains why teams win: shoot efficiently, protect the ball, finish possessions with rebounds and get to the line. The weights below are approximate, but the hierarchy has survived two decades of scrutiny — shooting matters roughly as much as the other three combined.
Pace, spacing and the math of the three

Modern offense is a spreadsheet wearing sneakers: a 35% three-point shooter produces 1.05 points per attempt, more than a 50% two-point shooter’s 1.00. Add spacing — defenders dragged out of the paint by shooters who must be respected — and you get the drive-and-kick league we watch today. Our deep dive on pace and space unpacks the whole machine.
Impact metrics: the all-in-one numbers
BPM, EPM, RAPTOR and their cousins try to compress a player’s full influence into one number per 100 possessions. They disagree at the margins — treat them as a panel of judges, not a verdict. When all of them like a player, believe it; when they split, watch the games. Definitions for every metric live in the public glossaries at NBA.com/stats and Basketball-Reference.
How to read a box score like an analyst
- Check TS% before points — 30 on 30 shots is a bad night.
- Check turnover differential — possessions are the currency, turnovers are theft.
- Check shot profile — rim attempts plus threes is the modern signature; long twos in volume are a warning light.
- Check net rating in the minutes that mattered — clutch lineups tell you what the coach really believes.