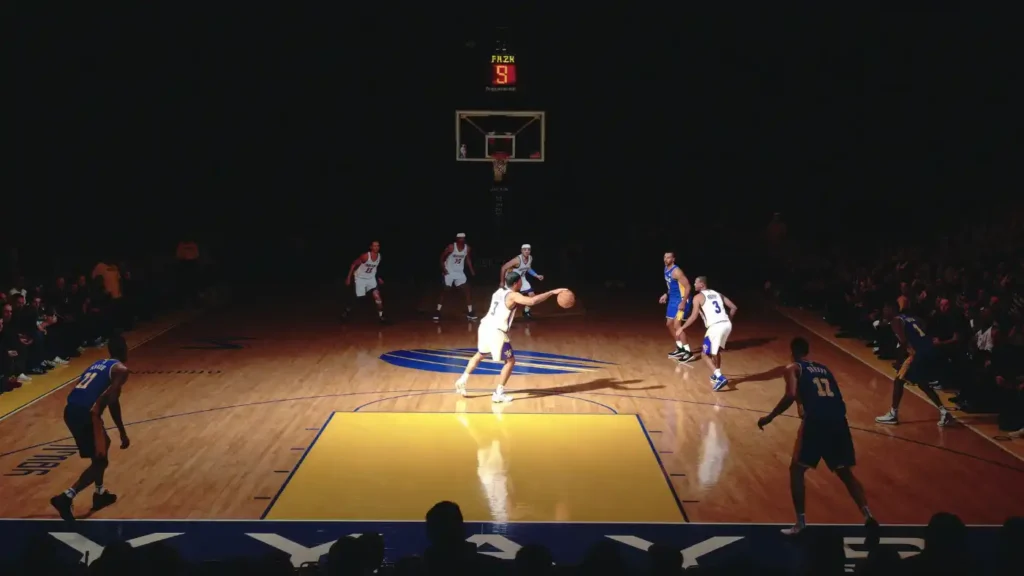
Usage rate answers a single question — what share of his team’s possessions does a player personally end? — and that one number explains MVP cases, trade values and why benches exist.
What exactly is usage rate?
The percentage of team possessions a player “uses” while on the floor — ended by his field goal attempt, his trip to the free throw line, or his turnover. Five players share the floor, so the league average is by definition 20 percent. Everything above that is offensive load; everything below it is a supporting role.
What counts as high?
Mid-20s marks a primary option. Thirty percent and up is star territory, reserved for offenses that run through one man. The historical ceiling is Russell Westbrook’s 41.7 percent in his 2016-17 MVP season — a number that doubles as a warning, because no team has won a title with usage that concentrated.
Does high usage mean good?
No — it means trusted. Usage measures volume, not quality; pair it with efficiency to get the real picture. The fundamental trade-off, often called the skill curve, is that efficiency tends to fall as usage rises: every extra possession a star absorbs is a harder one. The elite few who raise usage and hold their true shooting percentage — that is the actual definition of superstardom.

How does usage shape rosters?
Arithmetic forces specialization: if your star eats 33 percent of possessions, the other four players split 67. That is why front offices pay premiums for low-usage, high-impact wings — the 3-and-D archetype living at 12 to 15 percent — and why pairing two 30-percent stars often produces friction before it produces wins. Load also predicts fatigue: high-usage players decline measurably in fourth quarters and deep playoff runs.
Where can I see it?
Usage rate is listed under advanced stats for every player at NBA.com/stats. Sort any playoff roster by it and you will reconstruct the offensive hierarchy without watching a minute — then watch the minutes anyway, because usage tells you who ends possessions, never how beautifully.